- MarinePoland.com")
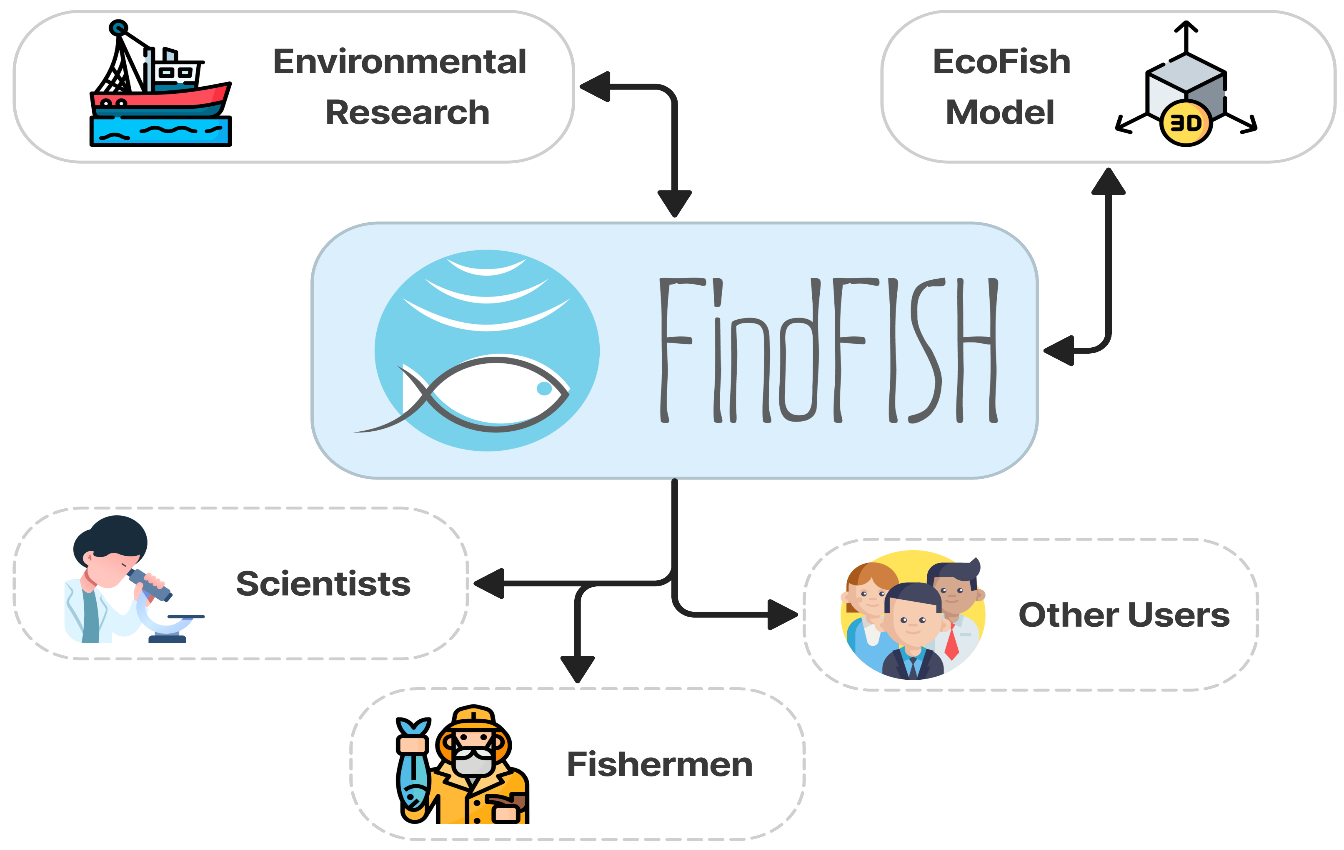
Quick access to expert knowledge is very valuable, especially in the context of decision-making, not only by fishermen, in order to diagnose under what hydrological conditions fisheries for four species: herring, sprat, cod and flounder should be the most abundant in resources. A digital/web service has been developed to meet these requirements. This is a service created as part of the FindFISH project, which provides results from developed models: hydrodynamic, biochemical and Fish - for specific species of fish caught industrially. The website works dynamically in the operational mode, enabling the visualization of forecasts in the form of maps, time and spatial series and tables.
The results of the Gdańsk Bay 3D EcoFish ecosystem model for the hydrodynamic module, the biochemical module and the Fish module for the fish species studied under the project is a service available on the FindFISH website (www.findfish.pl) through the "FindFISH Service" tab on the navigation bar and selecting "Model data" through "Enter" (Figure 1A), and then "Sign in to your account" (Figure 1B). Access to the service requires the creation of an account and is paid 50 PLN/month (payment in EURO is possible after conversion according to the average exchange rate of the foreign currency announced by the NBP on the last working day preceding the invoice date).
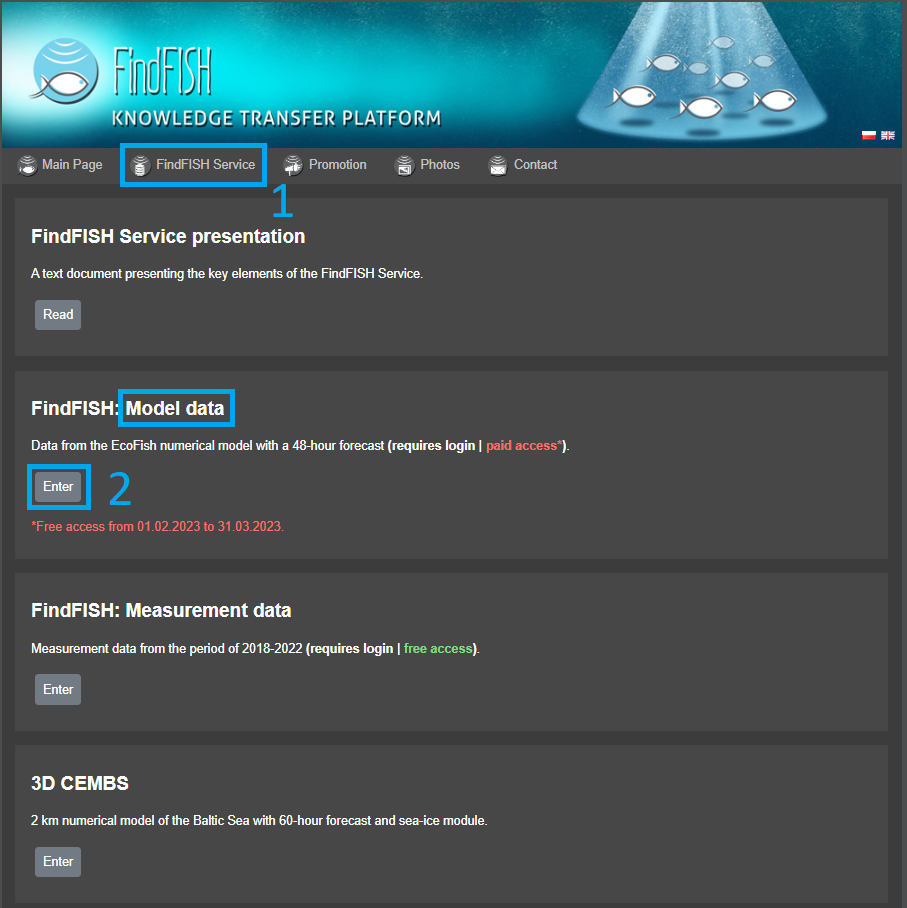
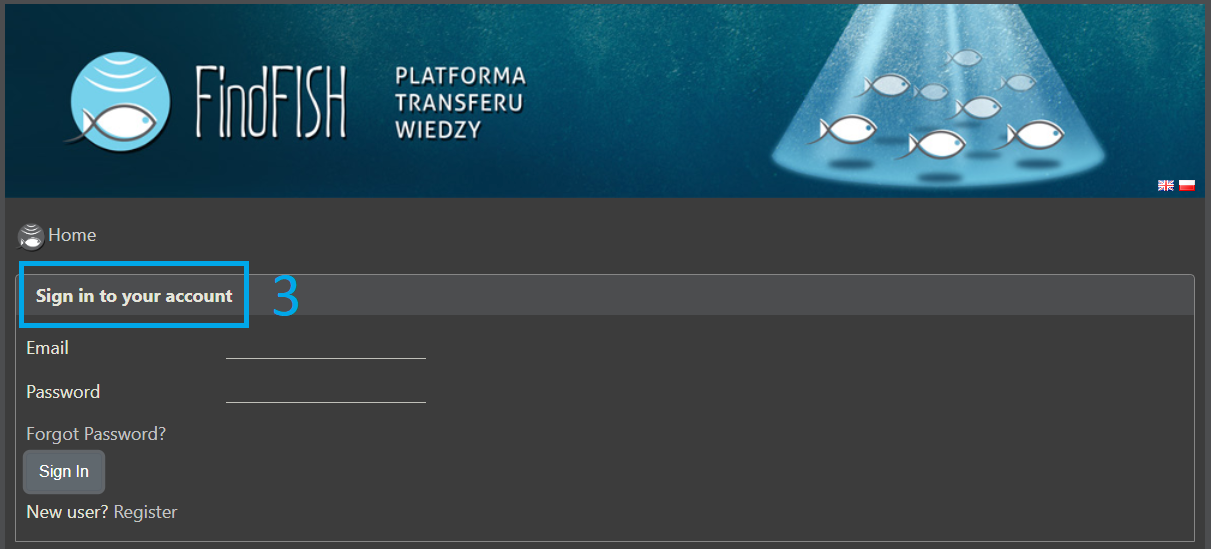
Fig. 1B. FindFISH project website and "Sign in to your account" section. Source: IOPAN own study.
The time period covered by the data in the FindFISH service starts from January 2017, up to the latest forecast, i.e. for the next 48 hours. For all model products (A) and variables (B), you can generate raster maps (C) for individual depths that represent the vertical level of the model. In addition, it is possible to create time (D1) and spatial (E) series for fixed periods in a selected location (after determining or indicating the desired latitude and longitude), as well as model data tables (D2) for the selected parameter (B).
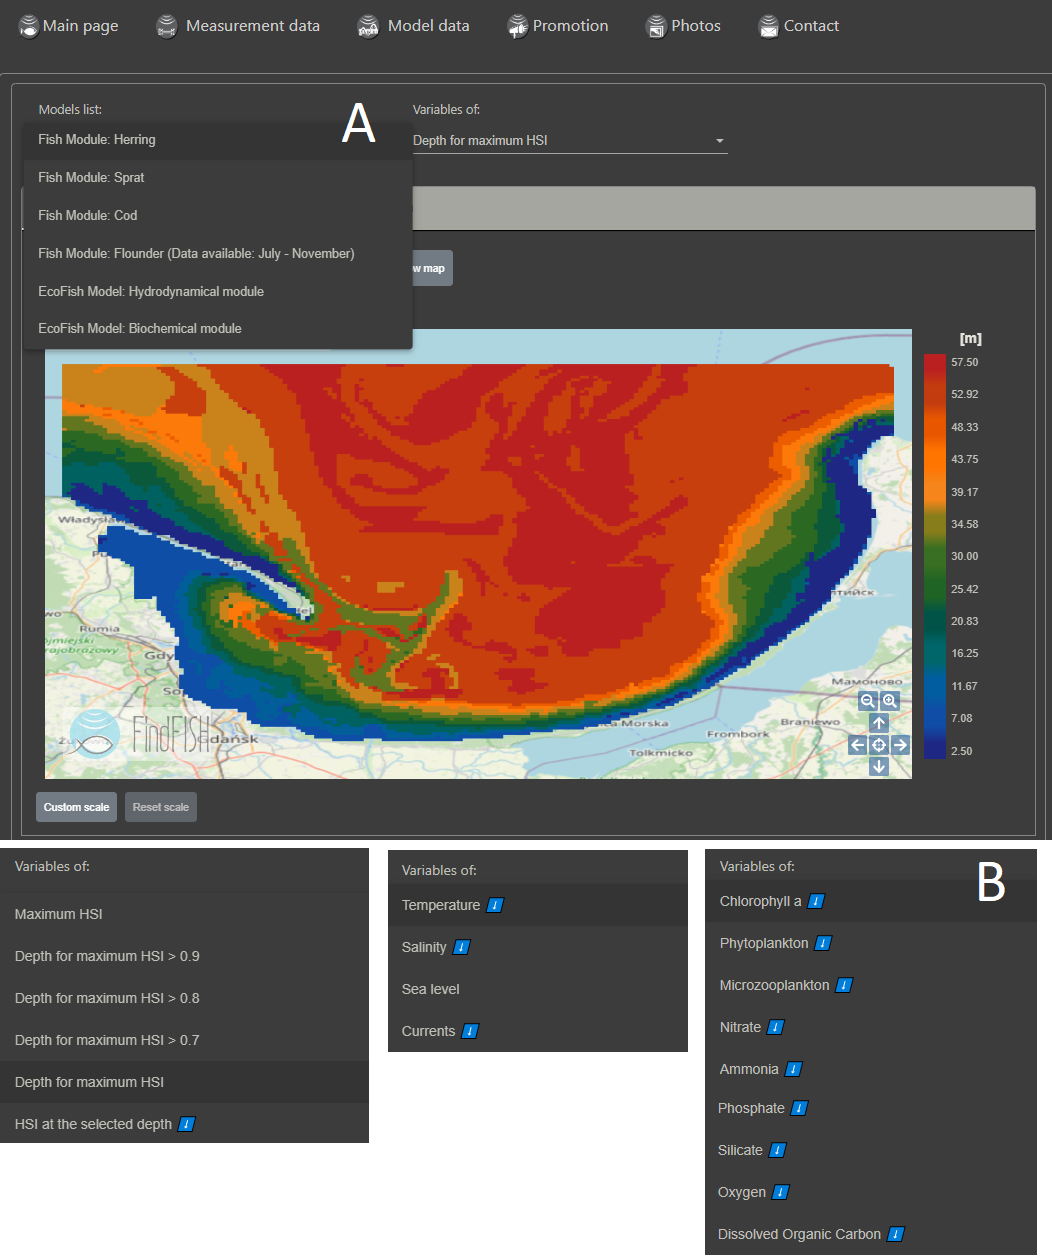
Fig. 2. The FindFISH project website and the selection of the "Model data" service - presentation: the selection of the model (A) and the selection of the Fish Module variable as well as the hydrodynamic and biochemical model (B). Source: IO PAN own study
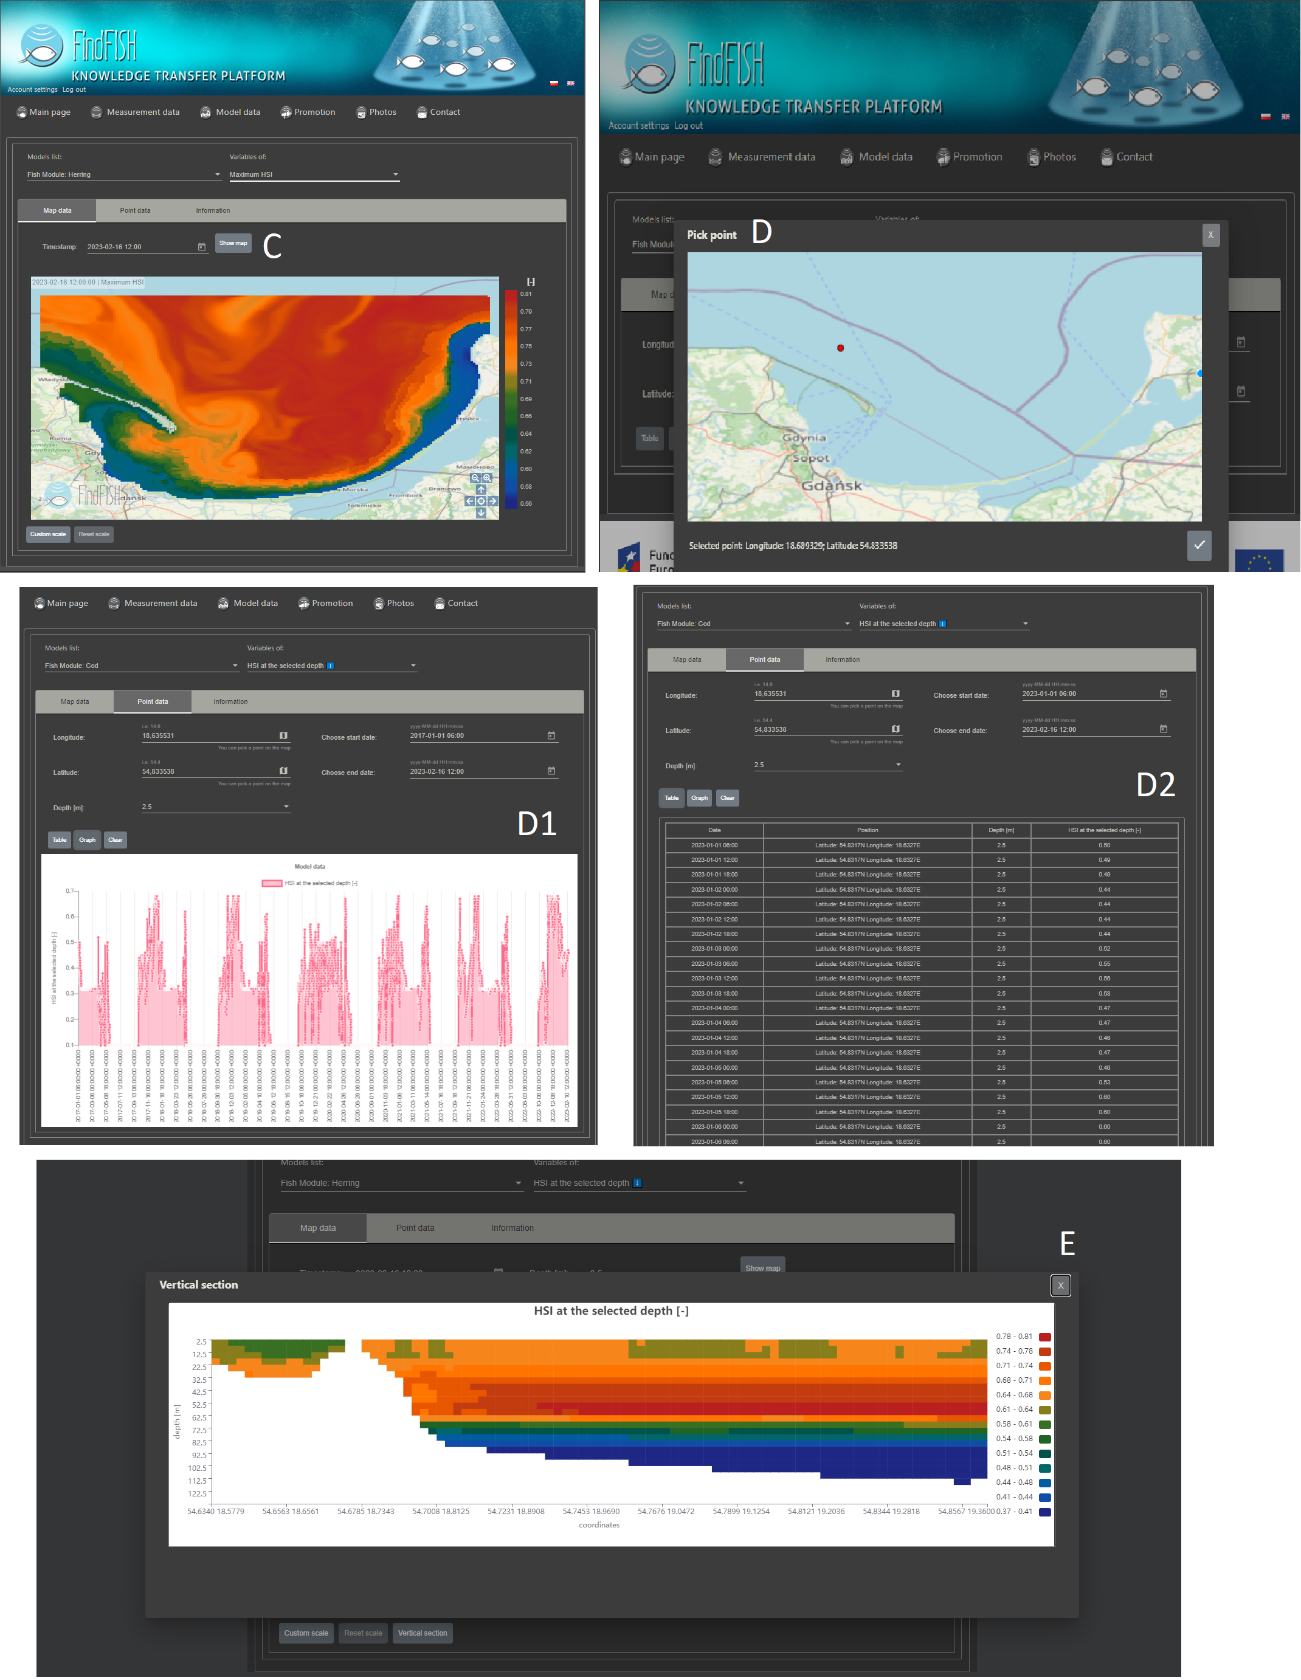
Fig. 2 (continued) The FindFISH project website and the selection of the "Model data" service – presentation of: results in the form of maps (C), graphs (D1) and tables (D2), for the selected point on the map (D) and for the selected time period, as well as for 3D variables in the form of vertical section between two selected points (E). Source: IO PAN own study
The following ways of presenting model data are available in FindFISH Service:
Spatial distribution (map): This is the default form of results presentation available in the "Map data" tab.
Spatial distribution (vertical section)*: Option available in the „Map data” tab. The „Vertical section” button allows you to select two locations on the map. After selection, a 2D plot is created with the spatial variation of the parameter between the selected locations from the surface to the bottom (*option available only for 3-dimensional (3D) variables).
Point time series (graph): Option available in the „Point data” tab. Select the location, depth, start and end date and press the „Graph” button. A graph is created showing the variability of the parameter at a selected location and time period.
Point time series (table): Option available in the „Point data” tab. Select the location, depth, start and end date and press the „Table” button. A table is created with the parameter values at selected location for consecutive days in the time period.
Through the "EcoFish Model – Hydrodynamical Module" service, forecasts of the following parameters are available: water temperature (°C), salinity (PSU), sea level (cm) and currents (cm·s-1) – value and direction, with a 48-hour forecast of these parameters. For example, maps for two hydrodynamic variables, temperature and currents at selected depths: 2.5 m and 27.5 m are presented below (Figures 3 and 4).
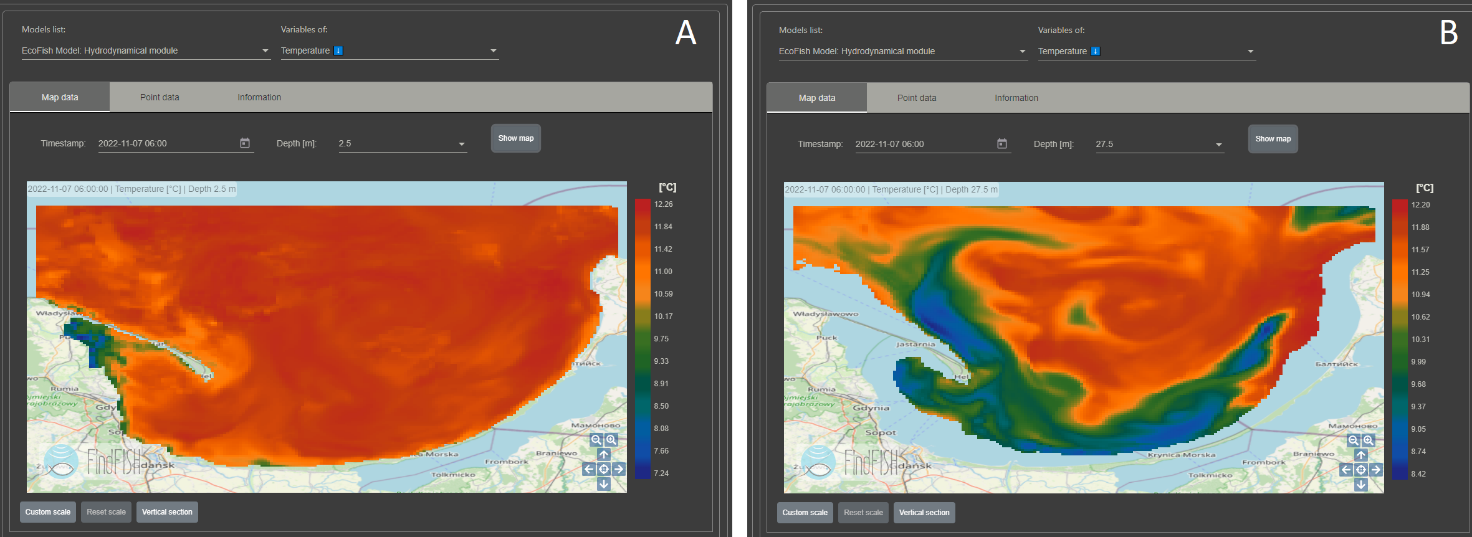
Fig. 3. Screenshot of the "EcoFish Model – Hydrodynamical Module" web portal service for the variable: temperature at a depth of 2.5 m (A) and 27.5 m (B) when selecting the "Map data" tab presentation. Source: IO PAN own study
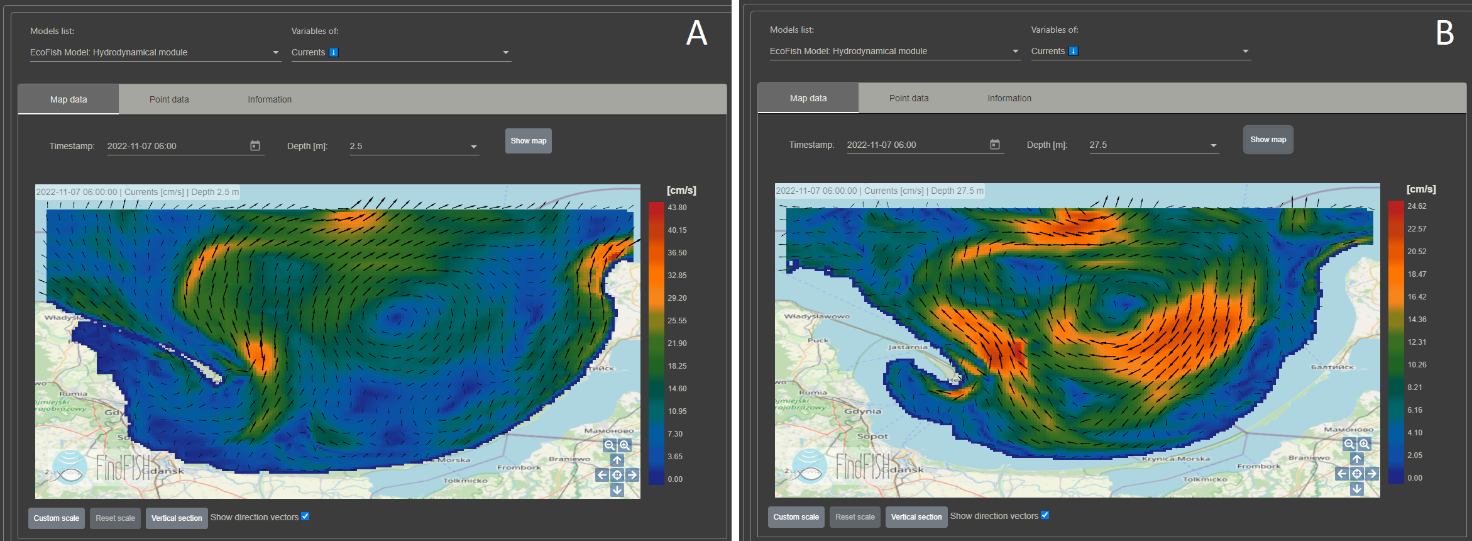
Fig. 4. Screenshot of the "EcoFish Model – Hydrodynamical Module" web portal service for the variable: currents at a depth of 2.5 m (A) and 27.5 m (B) when selecting the "Map data" tab presentation. Source: IO PAN own study
Through the "EcoFish Model - Biochemical Module" service, forecasts of the following parameters are available: chlorophyll a concentration (mg m-3), nitrates (mmol m-3), ammonia (mmol m-3), phosphates (mmol m-3) and silicates (mmol m-3), dissolved oxygen (mmol m-3), dissolved organic carbon (mmol m-3) phytoplankton biomass (mmol m-3) and microzooplankton (mmol m-3). As an example, maps are given for three biochemical variables, chlorophyll a concentration (Figure 5A), microzooplankton biomass (Figure 5B) and nitrate concentration at a depth of 2.5 m (Figure 6A) and 82.5 m (Figure 6B).
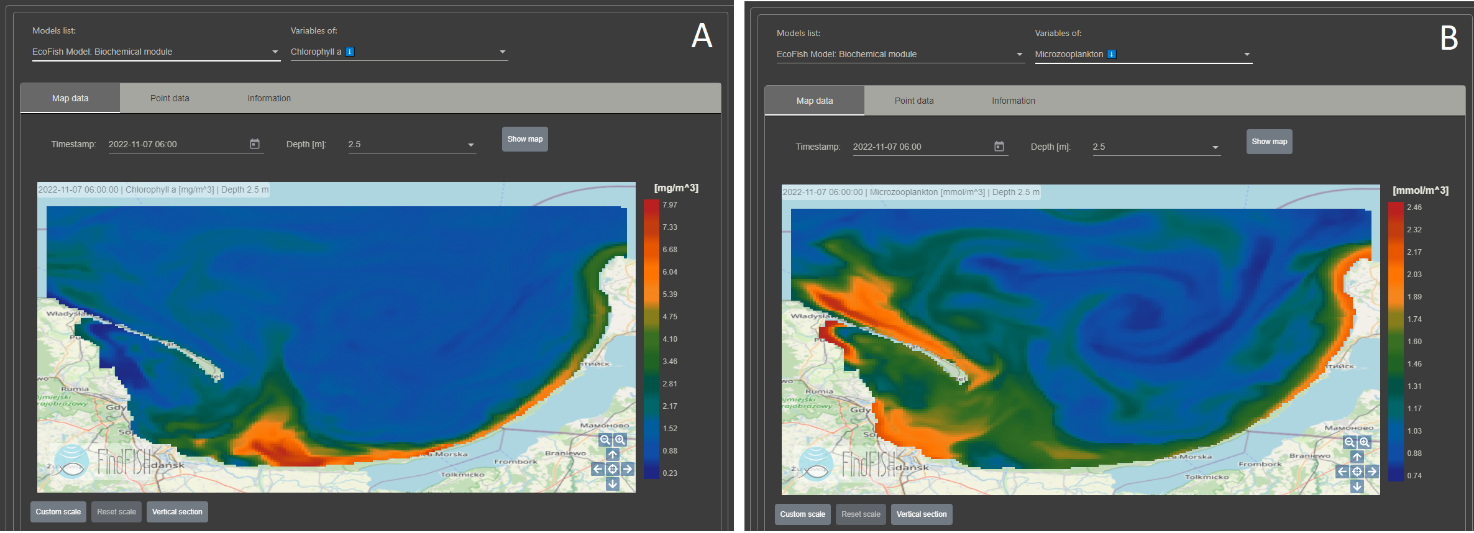
Fig. 5. Screenshot of the "EcoFish Model – Biochemical Module" web portal service for two variables: chlorophyll a concentration (A) and microzooplankton biomass (B) when selecting the "Map data" tab presentation. Source: IO PAN own study
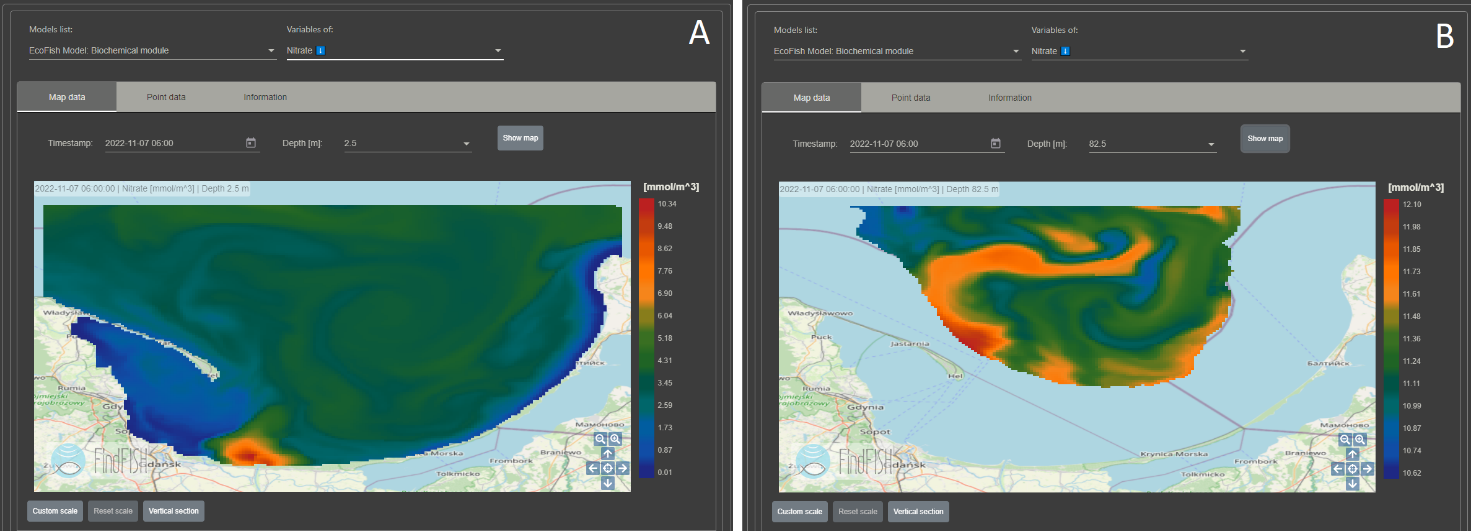
Fig. 6. Screenshot of the "EcoFish Model – Biochemical Module" web portal service for the variable: nitrate concentration at a depth of 2.5 m (A) and 82.5 m (B) when selecting the "Map data" tab presentation. Source: IOPAN own study
Through the "Fish Module" service, presenting under what hydrological conditions fisheries for four species (herring, sprat, cod and flounder) should be the most abundant in resources, data are available: maximum HSI(*) in the water column, depth for maximum HSI > 0.9, depth for maximum HSI > 0.8, depth for maximum HSI > 0.7, depth for maximum HSI in the water column and HSI at the selected depth, with a 48-hour forecast of these parameters. As an example, maps are given for three variables regarding herring: HSI at the selected depth of 2.5 m (Figure 7A) and 47.5 m (Figure 7B), maximum HSI in the water column (Figure 8A) and depth for maximum HSI in the water column (Figure 8B).
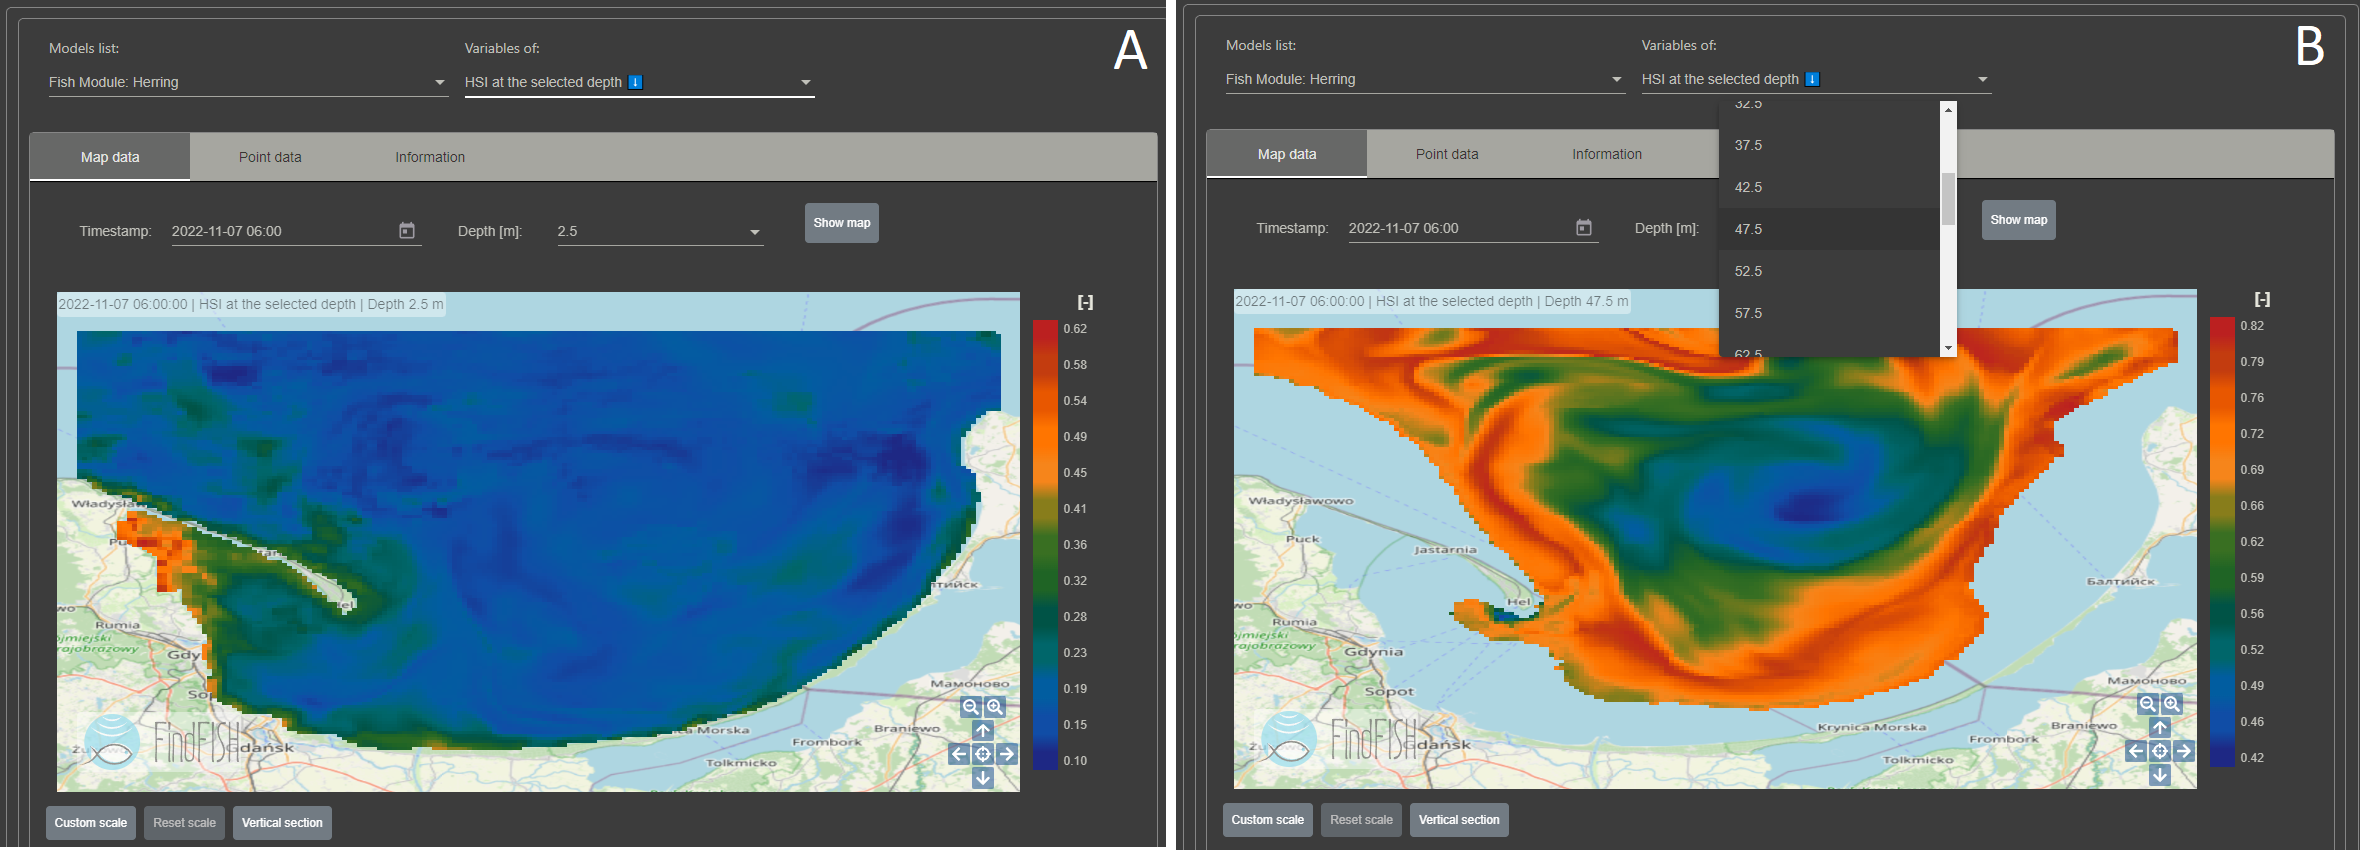
Fig. 7. Screenshot of the "Fish Module – Herring" web portal service for the variable: HSI at the selected depth of 2.5 m (A) and 47.5 m (B) when selecting the "Map data" tab presentation. Source: IO PAN own study
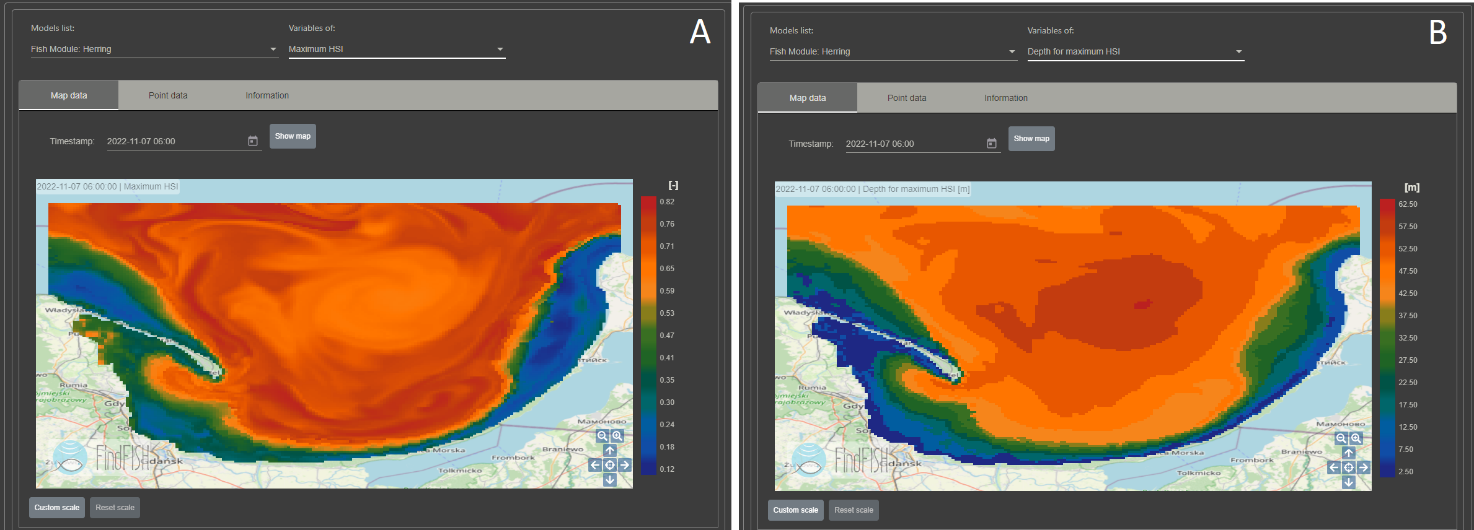
Fig. 8. Screenshot of the “Fish Module – Herring” web portal service for two variables: maximum HSI in the water column (A) and depth for maximum HSI in the water column (B) when selecting the "Map data" tab presentation.
For example, presentation was provided by selecting "Point data" for the parameter - Maximum HSI in the water column, for herring at a given time period, e.g. year 2022, in the form of a graph (Figure 9) and a table (Figure 10).
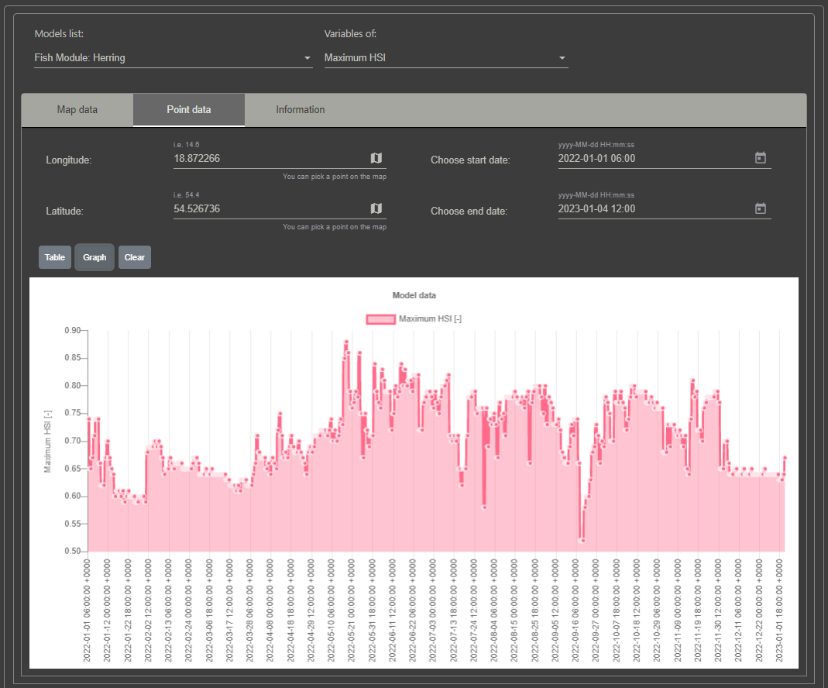
Fig. 9. Screenshot of the "Fish Module – Herring" web portal service for the variable: maximum HSI in the water column for year 2022 in the form of a graph when selecting the "Point data" tab presentation and "Graph" button. Source: IO PAN own study
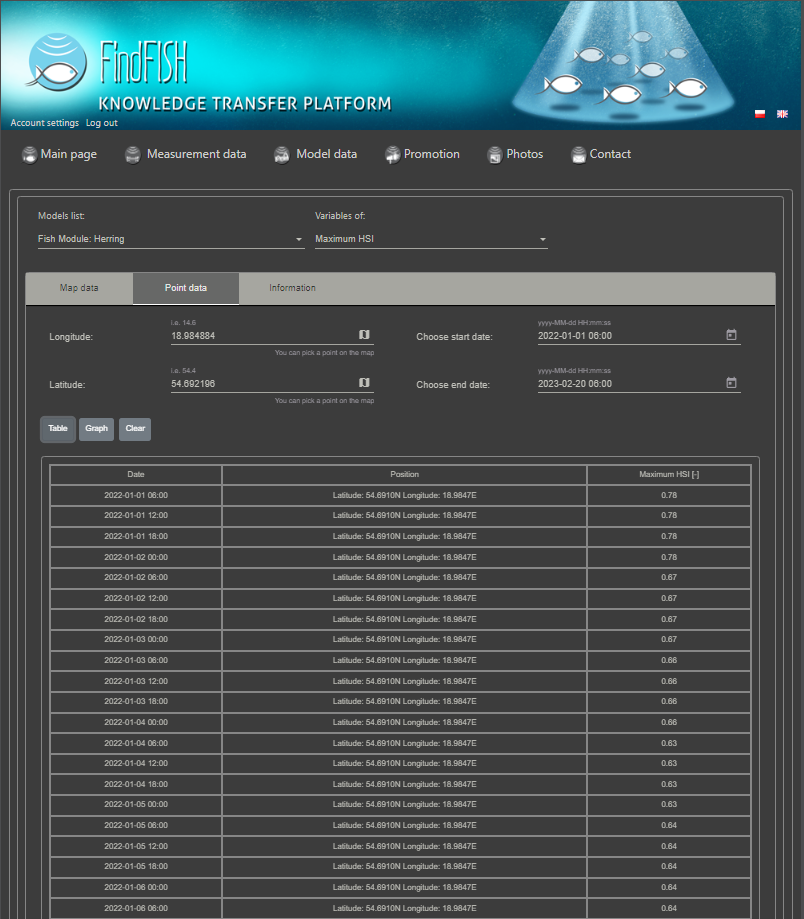
Fig. 10. Screenshot of the "Fish Module – Herring" web portal service for the variable: maximum HSI in the water column, in the form of a table for the selected period when selecting the "Point data" tab presentation and “Table” button.
The service also gives the possibility of presenting data in a vertical section, only for 3-dimensional (3D) variables, by selecting two locations on the map (Fig. 11A). After selection, a 2D plot is created with spatial variation for the selected parameter between the selected locations from the surface to the bottom (Fig. 11B). In Figure 11, data presentation using "Vertical section" was added, for the HSI at the selected depth variable for herring.
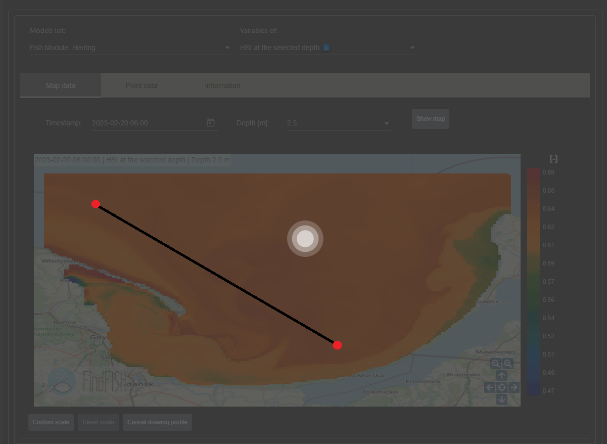
Fig. 11. Screenshot of the "Fish Module – Herring" web portal service for the variable: HSI at the selected depth, when selecting the "Map data" tab presentation and then "Vertical section" button. Source: IO PAN own study
(*) Habitat Suitability Index (HSI)
"It is the quotient of the numerical values expressing the habitat conditions in the study area and the values reflecting the optimal habitat conditions for a given species".
HSI takes values in the range of [0,1]
HSI = 0 – the habitat does not meet the conditions for the existence of the species in any way
HSI = 1 – the habitat is characterized by optimal conditions for the existence of the species
To display the results of the Fish Module, select:
One of the available parameters:
Maximum HSI – field showing the maximum HSI values in the water column
Depth for maximum HSI > 0.9 – a field showing the depths (in meters) at which the maximum HSI occurs in the water column (limited to HSI > 0.9 only)
Depth for maximum HSI > 0.8 – a field showing the depths (in meters) at which the maximum HSI occurs in the water column (limited to HSI > 0.8 only)
Depth for maximum HSI > 0.7 – a field showing the depths (in meters) at which the maximum HSI occurs in the water column (limited to HSI > 0.7 only)
Depth for maximum HSI – a field showing the depths (in meters) at which the maximum HSI occurs in the water column
HSI at selected depth – a 3D field showing the HSI values at the selected depth
Calendar date
Depth (available only for the „HSI at the selected depth” parameter)
Confirm your selection with the „Show map” button.
Occasional shortages of current forecasts may be caused by service work on the Tryton computing cluster and/or delays in access to forcing data.
Relationship between fishing efficiency and HSI
Figure 12 presents an example of a successful fishing expedition by the ZAG-17 vessel. The effective fishing time during this expedition lasted just over 5 hours and the vessel used pelagic trawl, resulting in a catch of 10,800 kg of sprat with a fishing efficiency of 2,146 kg h-1.
The vertical HSI profile along the fishing route (Fig. 12 b) clearly shows that the pelagic trawl operated at depths between 30 and 50 meters, corresponding to the maximum HSI values along this route.
The average HSI was 0.76 with a maximum of 0.79 (Figure Fig. 12c). This indicates a well-chosen location and fishing depth by the skipper, resulting in an efficient catch.
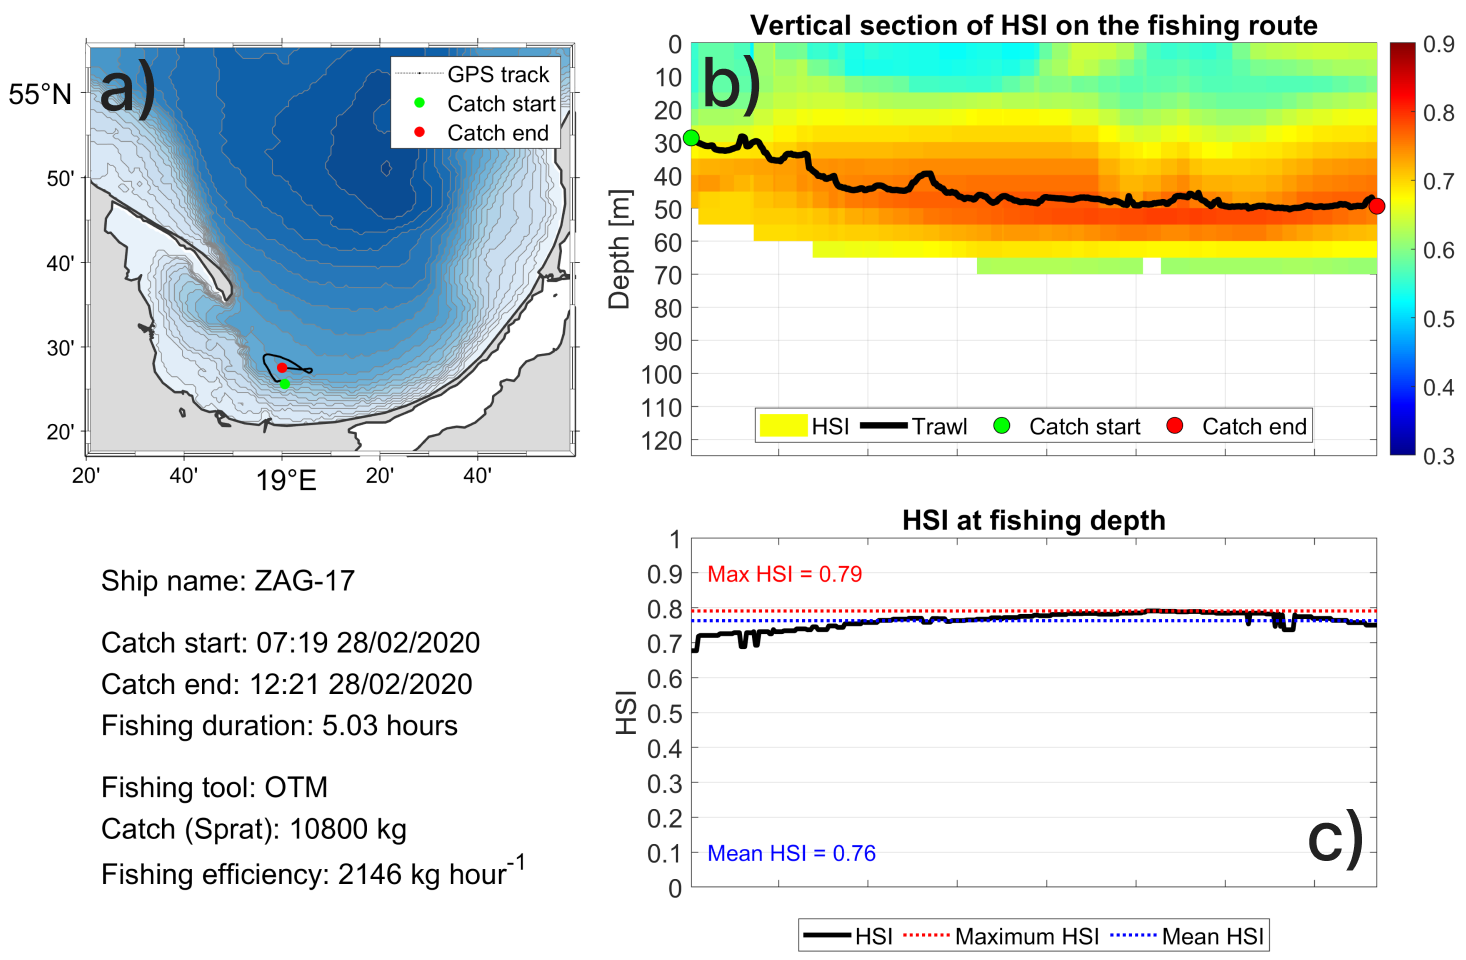
Fig. 12. The details of successful fishing expedition of ZAG-17 on February 28, 2020; a) GPS track, b) vertical HSI section along the route, and c) HSI values during this expedition. Source: IO PAN own study
The FindFISH Platform, developed for fishermen, aims to enhance fishing efficiency and reduce environmental impact. This tool, a first of its kind, uses a numerical method to forecast marine conditions in the Gulf of Gdańsk (southern Baltic Sea), assistance in locating optimal fishing spots.
Targeting a diverse market, FindFISH promises profitability and reduced operational costs for the fishing industry, while ensuring sustainability and environmental protection.
The platform is developed through a collaboration between scientific institutes and a fishermens, integrating real-time data and models.
Our research showed that the FindFISH service can enhance fishing efficiency and quality by approximately 40%, significantly increasing expected profits. In practical applications, we observed a 50% to 70% concordance between the fishing spots recorded by fishermen and those identified by the FindFISH Platform.
The leader of the project "Knowledge Transfer Platform FindFISH - Numerical Forecasting System for the Marine Environment of the Gulf of Gdańsk for Fisheries" is the Institute of Oceanology of the Polish Academy of Sciences with its seat in Sopot, and the head of the project is prof. dr hab. Lidia Dzierzbicka-Głowacka.
The project is co-financed from the European Regional Development Fund (ERDF) under the Regional Operational Program for the Pomeranian Voivodeship for 2014-2020, Priority Axis 01. Commercialization of knowledge, Measure 01.01. Expansion through innovation, Sub-measure 01.01.01. Expansion through innovation.
Lidia Dzierzbicka-Głowacka